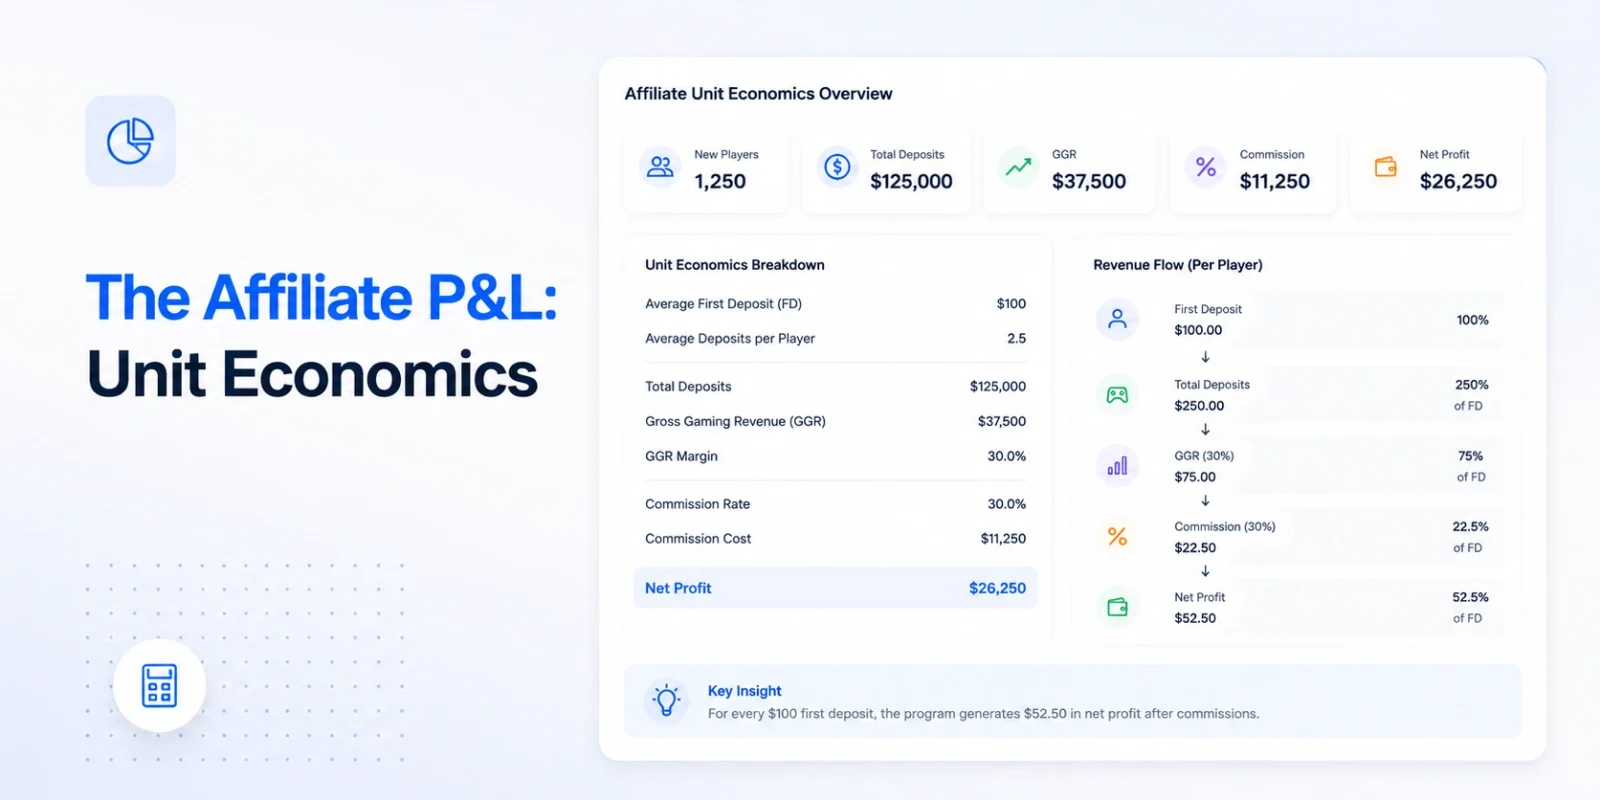
There’s a number every operator should be able to recite from memory. Most can’t.
It’s not revenue. It’s not active players. It’s not even NGR. It’s the contribution margin per affiliate — what each partner actually returns to the operator after every cost, every fraud loss, every bonus, every overhead hour is accounted for. It’s the only number that tells you whether your affiliate program is a profit center or a subsidized marketing line.
The reason most operators can’t recite it isn’t that it’s hard to calculate. It’s that most platforms don’t expose the inputs cleanly. The data is there. The columns are wrong, or the data lives in three different dashboards, or the fraud losses sit in a finance report the affiliate team never sees. So the number never gets calculated honestly. And the program gets managed on volume.
This piece is about that number, and the financial anatomy of an iGaming affiliate program. It’s written for operators who want to know what their program actually costs and what it actually returns — and who want to make decisions on the P&L, not on the activity dashboard.
What an affiliate program actually costs, line by line
Start with the obvious. Then keep going.
- Commissions paid. The big one, the one everyone tracks. CPA payouts, RevShare, hybrid deals, sub-affiliate overrides, tiered bonuses, leaderboard prizes. If your program is at stage three or four, this is the single largest line in the cost column, and it grows as the program scales. The model is documented well enough — we and others have written the CPA configuration playbook and the RevShare/CPA hybrid math — so I won’t re-litigate it here. The thing most operators miss isn’t the model. It’s the leakage.
- Bonus abuse losses. When an affiliate sends a player who hits a signup bonus, plays through the rollover, and cashes out, that’s not fraud in the technical sense. It’s a cost of acquisition you didn’t price in. We’ve covered the mechanics of post-conversion bonus abuse elsewhere; here it’s a P&L line. A 10% bonus abuse rate against an active affiliate is meaningful. A 25% rate against your top three affiliates is an emergency.
- Chargebacks and refund losses. Fraud-driven chargebacks, friendly fraud, payment-processor chargeback fees, the team time spent on representments. If your platform doesn’t surface this back to the affiliate that drove the player, it shows up in finance as a generic “fraud loss” line with no source attribution. The operator eats it. The affiliate who drove it gets credited with the FTD. The misalignment is the point.
- Payment processing on payouts. Operators forget this. You’re paying affiliates via wire, SEPA, or crypto. Each has a fee, each has a settlement window, each has an FX cost if your affiliate base is international. On a $50K monthly payout, processing alone can be 0.5–1.5%. That’s $250–750 a month you didn’t model.
- Held capital and treasury cost. Affiliates get paid on the 1st and 15th, or at month end, or when a threshold hits. Until you pay, that money is your working capital. If your program pays $400K a month and your average hold is 15 days, you’re floating ~$200K. The treasury cost is real, even if it never shows up in the affiliate P&L.
- Affiliate management overhead, amortized. Two AMs at fully loaded $120K, supporting 300 affiliates, is $800 per affiliate per year before you’ve paid a cent in commission. For a tier-one program this is rounding error. For a long-tail program, it can be 8–15% of contribution margin before any player activity.
- Platform and tooling cost. The affiliate platform license, the BI tool, the fraud vendor, the postback monitoring, the reporting layer. Most operators fold this into “marketing overhead” and never allocate it back to the program. It belongs on the affiliate P&L, because if you can’t pay for the platform out of program contribution, you have a structural problem.
Add those up. For a typical mid-market iGaming program — somewhere around 2,000 to 5,000 depositing players a month — the all-in cost per FTD is usually 35–60% higher than the headline commission rate. The number depends on program maturity, geo mix, and fraud posture, but the gap is the rule, not the exception.
What an affiliate program actually returns, line by line
Revenue from a program is the easiest line to overstate. Most operators stop at “FTD value × first-deposit amount” and call that the return. That’s not a return. That’s gross intake.
- FTD value. The first deposit, gross. The number your affiliate dashboard surfaces as a victory metric. It’s almost never the right denominator for any decision.
- Second-deposit conversion rate. The percentage of FTDs who deposit again. In iGaming, the median is 25–40% across most geos. The affiliates driving players who don’t redeposit are driving revenue that has a 30-day half-life. That’s a P&L implication, not just a UX implication.
- Active player count at 30/60/90. What percentage of acquired players are still active at 30, 60, 90 days. The cohort decay curve is where you find out which affiliates are actually generating players and which are generating signups that disappear. The predictive churn work is essentially about reading this curve before it completes.
- Net Gaming Revenue (NGR). The cleanest top-line number for return. House edge minus winnings paid, minus bonuses, minus chargebacks. NGR is the number finance should be looking at when evaluating the program. Most operators look at GGR, which is more flattering and less honest. We’ve broken down the GGR vs NGR distinction before, but the short version is: if your affiliate P&L uses GGR, you’re lying to yourself at the line-item level.
- Player LTV at 90/180/365. The metric that separates programs that compound from programs that subsidize. An affiliate driving 1,000 FTDs at $50 average first deposit looks identical to one driving 1,000 FTDs at $50 average first deposit — until you track the LTV curve and discover the second program has $200 90-day LTV and the first has $40. The first affiliate is a subsidized signup machine. The second is a profit center.
- Reactivation revenue. The players an affiliate drove who churned at month three and came back at month eleven. This is real revenue, attributable to the original acquisition source. Most platforms don’t track it cleanly. Mature programs do, and the difference shows up in long-run affiliate value.
- Cross-brand revenue. If you run multiple brands, the players one affiliate brings to brand A who migrate to brand B and deposit there. Without multi-brand attribution, that revenue shows up unattributed and you can’t see the full value of your top partners.
The asymmetry here is what most operators miss. On the cost side, the program gets charged line by line. On the return side, the program gets credit for the first deposit only. Until the return side is fully attributed and cohort-curve-adjusted, every financial decision in the program is being made on partial data.
Contribution margin per affiliate: the real ranking
Here’s the calculation, simplified:
Contribution margin = NGR-driven revenue − commissions paid − bonus abuse losses − chargeback/fraud losses − AM overhead allocated − platform/tooling allocated
Some operators net out payment processing. Some include treasury cost. The exact line items vary. The principle doesn’t.
Run this calculation across your top 30 affiliates. The ranking will surprise you. It almost always does.
The affiliate you’ve been paying the most isn’t usually the one with the highest contribution margin. The affiliate driving the most FTDs is rarely the one driving the most profitable players. The affiliate you’ve been giving exclusive promotional support to is sometimes — not always, but sometimes — a margin drag that’s been subsidized by your better partners.
The reason is structural. Volume and value are not the same axis. An affiliate sending 500 FTDs a month from tier-3 traffic sources, with a 15% second-deposit rate and a $35 average 90-day LTV, generates $17,500 in LTV-driven NGR. The platform and commission cost on that affiliate might be $12,000. Contribution margin: $5,500. Compare to an affiliate sending 200 FTDs from a curated SEO presence, with a 45% redeposit rate and a $180 LTV. NGR contribution: $36,000. Cost: $14,000. Contribution margin: $22,000. The second affiliate is 4x more profitable on 40% of the volume.
Volume rankings flatter the first affiliate. Contribution margin rankings surface the second. The operators who run their program on volume rankings optimize for the wrong metric. The operators who run on contribution margin optimize for the program they actually have.
The uncomfortable implication: a meaningful percentage of your affiliate roster is destroying value. Not net-negative, where the affiliate pays you to acquire players — that almost never happens. But value-destroying, where the affiliate’s true cost (after fraud loss, AM overhead, processing, and the long-tail of one-time-deposit players) exceeds their true return. The P&L tells you who they are. The activity dashboard hides it.
CAC payback and LTV/CAC, by affiliate
Two numbers every operator should be able to produce on a per-affiliate basis. Most can’t.
CAC payback period = cumulative cost of acquiring and serving a cohort of players driven by a specific affiliate ÷ monthly revenue per retained player. Practically: how many months until the cumulative NGR from that cohort exceeds the cumulative cost.
For tier-1 affiliates sending high-LTV players, payback is typically 3–5 months. For affiliates driving one-and-done signups, payback is 9–14 months — if it ever happens. Some affiliates never reach payback. Their players deposit once, lose (or win and leave), and the operator subsidizes the loss for the life of the account.
LTV/CAC ratio is the health check. The textbook number is 3:1. In iGaming, mature programs run 4:1 to 6:1 across the program, with the best affiliates above 10:1 and the worst below 1:1. If your program-wide average is below 3, you’re not running a marketing channel — you’re running a customer-acquisition charity.
The reason this matters for the P&L is that payback and LTV/CAC are the numbers that justify your top payouts. If an affiliate driving 8:1 LTV/CAC players wants a $400 CPA instead of $300, the right question isn’t “can we afford it?” — it’s “is the LTV uplift worth $100 per FTD?” Usually yes. If the affiliate driving 0.8:1 LTV/CAC players wants a CPA bump, the right question is “should we be paying this affiliate at all?”
These calculations only work with clean data. The platform you use has to do two things: attribute the FTD correctly to the affiliate that drove it — which server-side tracking and weighted attribution models are built for — and follow the player through their lifecycle, not just to first deposit. Most platforms do the first. Many stop at the FTD and never build the LTV curve back to the affiliate. The ones that don’t are running an incomplete P&L.
The hidden cost of the long tail
In a typical mid-market iGaming program, 50–70% of active affiliates drive under 5% of NGR. The math is the same everywhere. We’ve seen it on small programs and on the largest tier-1 brands in the industry.
The instinct is to keep these affiliates. They might break out. They cost little to maintain. They’re “in the pipeline.” The problem is what they actually cost.
- Direct costs. A flat CPA paid on a low-value FTD is a real outflow. A RevShare paid on a player who deposits once and never returns is real money out. The affiliates driving these players get the same per-transaction economics as tier-1 partners. The economics don’t know the player is low-LTV.
- Indirect costs. Every active affiliate gets onboarded, gets a contract, gets reviewed for compliance, gets tagged in the platform, gets reporting access, gets support tickets answered. Two AMs supporting 400 affiliates where 200 of them are dormant or low-value is the same headcount as two AMs supporting 200 active, productive affiliates. The cost per active partner doubles.
- Risk costs. Long-tail affiliates are disproportionately the source of fraud patterns, compliance issues, and brand-safety problems. Not because they’re malicious. Because they’re under-resourced, under-vetted, and often running on borrowed traffic. The operator’s exposure to chargeback, regulatory, and reputational risk is concentrated in the long tail.
- The active kill list. Mature operators run one. They review contribution margin quarterly. Affiliates below a threshold — say, negative or sub-zero contribution over a trailing 6-month window — get a conversation. Sometimes the affiliate turns it around. Often they don’t. The ones that don’t get deactivated, the commission leakage stops, and the AM’s time gets reallocated to productive partners.
This isn’t a cynical exercise. It’s a P&L discipline. The same way a portfolio manager prunes underperforming positions, an affiliate program prunes underperforming partners. The programs that don’t do this wonder why their margins are flat. The programs that do wonder how they ever ran a 600-affiliate roster with two AMs.
The financial dashboard mature operators actually run
A few things change when a program is run on the P&L instead of the activity dashboard.
- Cadence moves from monthly to weekly, then to live. Most programs report on month-end. By the time you know affiliate X was driving low-LTV players, the cohort is 30 days old and you’ve paid out two cycles. Mature programs read contribution margin on a rolling 7-day window, and the platform’s data layer feeds the calculation. The zero-clicks dashboard pattern — where the answer comes to the operator, not the other way around — applies here directly.
- Metrics swap. FTD count, click count, and conversion rate stay in the activity view. The financial view is NGR, contribution margin, LTV/CAC, payback period, and a 30/60/90 active cohort view per affiliate. Most programs surface some of these. Few surface all of them per affiliate in real time. The ones that do make different decisions.
- AI does the watching, humans do the calling. A mature program has predictive models flagging when an affiliate’s player quality is decaying before the LTV curve confirms it. The model isn’t a replacement for the AM — it’s an early-warning system. The AM gets a Slack notification: “Affiliate 247’s 7-day player quality is down 22% week over week. Recommend a conversation.” The AM has the conversation. The platform has done the work that would have taken the AM three days of querying.
- Cross-functional alignment. The financial view requires the affiliate team and the finance team to read the same numbers. Most operators have a finance team that reads the GL and an affiliate team that reads the platform dashboard. The two views are reconciled once a quarter, if at all. Mature programs reconcile continuously. The P&L is one document, not two. The data export and reconciliation work matters here — if your platform makes it hard to get clean data out, your finance team will always lag the affiliate team by 30 days.
- The 4 metrics on the operator’s desk every morning. NGR-driven by affiliate program (vs target), contribution margin (program-wide and per top-10), LTV/CAC (rolling), and one anomaly flag from the predictive layer. That’s the AI agent work made operational. If your program can be summarized in four numbers every morning, it’s being managed. If it can’t, it’s being reported on.
The decision this changes
The P&L doesn’t just describe the program. It changes the decisions you can make confidently.
- On pricing. If your program-wide LTV/CAC is 4.5:1 and the marginal CPA you’re paying is 35% of LTV, you have room to pay more — strategically, to the affiliates driving the highest LTV. If your LTV/CAC is 1.8:1, you don’t have room to pay more; you have a structural problem that a CPA bump won’t fix.
- On the top 10. The affiliates you treat as tier-1 should be the top 10 by contribution margin, not the top 10 by FTD count. Most programs sort by FTD count. The P&L sorts by margin. The two rankings overlap by maybe 60%. The 40% that don’t overlap is where your renegotiations happen — and where you discover that some of your best partners are being underpaid and some of your worst are being over-rewarded. The platform that can run this analysis without a quarter-end scramble changes how the recruitment conversation goes — because now you’re recruiting on margin, not volume.
- On the long tail. The active kill list becomes a quarterly exercise instead of a guilt-ridden one. You have the data. You have the margin threshold. You have the conversation. Some affiliates recover. Some don’t. Either way, your program is healthier and your AMs are spending time on partners that compound.
- On expansion. The P&L tells you which GEOs are profitable per acquisition source, which traffic types produce the best LTV curves, which commission model actually drives the right behavior in your market. The case for LATAM expansion, for example, isn’t “Brazil looks big” — it’s “our contribution margin per FTD in Brazil is X, our payback is Y months, our LTV/CAC is Z. Here’s the budget.” Without the P&L, expansion is a guess. With it, expansion is a forecast.
- On the platform itself. The platform you use has to be the platform that can run the P&L. If it can attribute correctly, follow the player to LTV, expose contribution margin per affiliate, run the predictive layer, and surface the four-number daily view, you’re working with a financial system. If it can’t — if it stops at the FTD, if it can’t separate fraud loss by source, if it can’t model LTV at the affiliate level — you’re working with a tracking tool, and you’re running a financial operation on incomplete data. The operators who eventually run the P&L on the program often discover the platform they had at stage two isn’t the platform they need at stage four. We’ve written about the cost of that migration elsewhere. The honest answer is that most operators who get serious about the P&L end up either migrating or renegotiating.
The P&L is a way of seeing
Once you can see contribution margin per affiliate, the program stops being a list of partners and becomes a portfolio. Once you see payback period, the top-10 list stops being a marketing conversation and becomes a financial one. Once you see LTV/CAC, the platform stops being a tracking tool and becomes a financial system.
Most operators aren’t there yet. The good news: the data already exists in your program. It’s just sitting in different dashboards, different systems, different reports. The work is reconciliation and discipline, not technology. The discipline is running the P&L every month, every quarter, and letting it drive the decisions. The technology is making sure the platform you’re on can produce the numbers without a quarter-end scramble.
If you can name the contribution margin of your top three affiliates from memory, you’re ahead of most operators in the industry. If you can’t, that’s the first move. The P&L doesn’t have to be perfect to be useful. It just has to be honest.